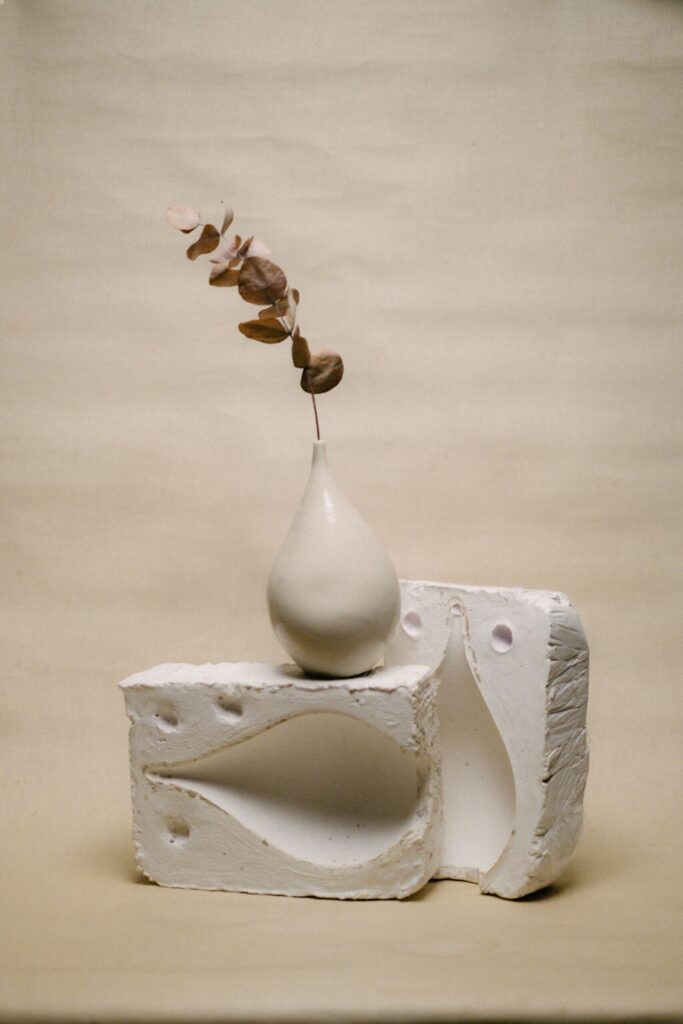
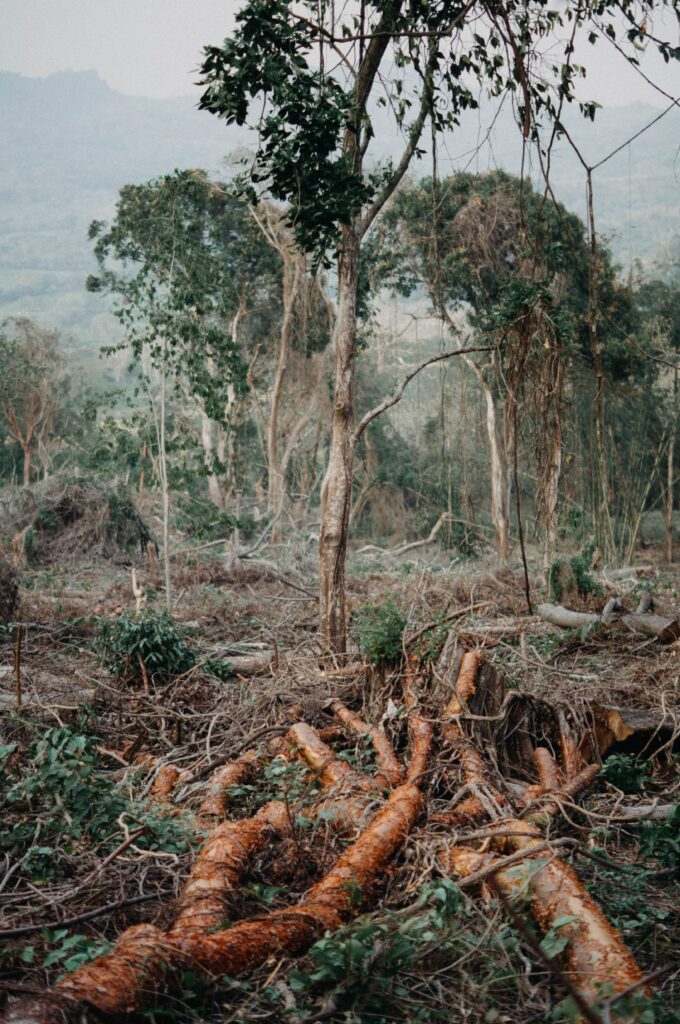
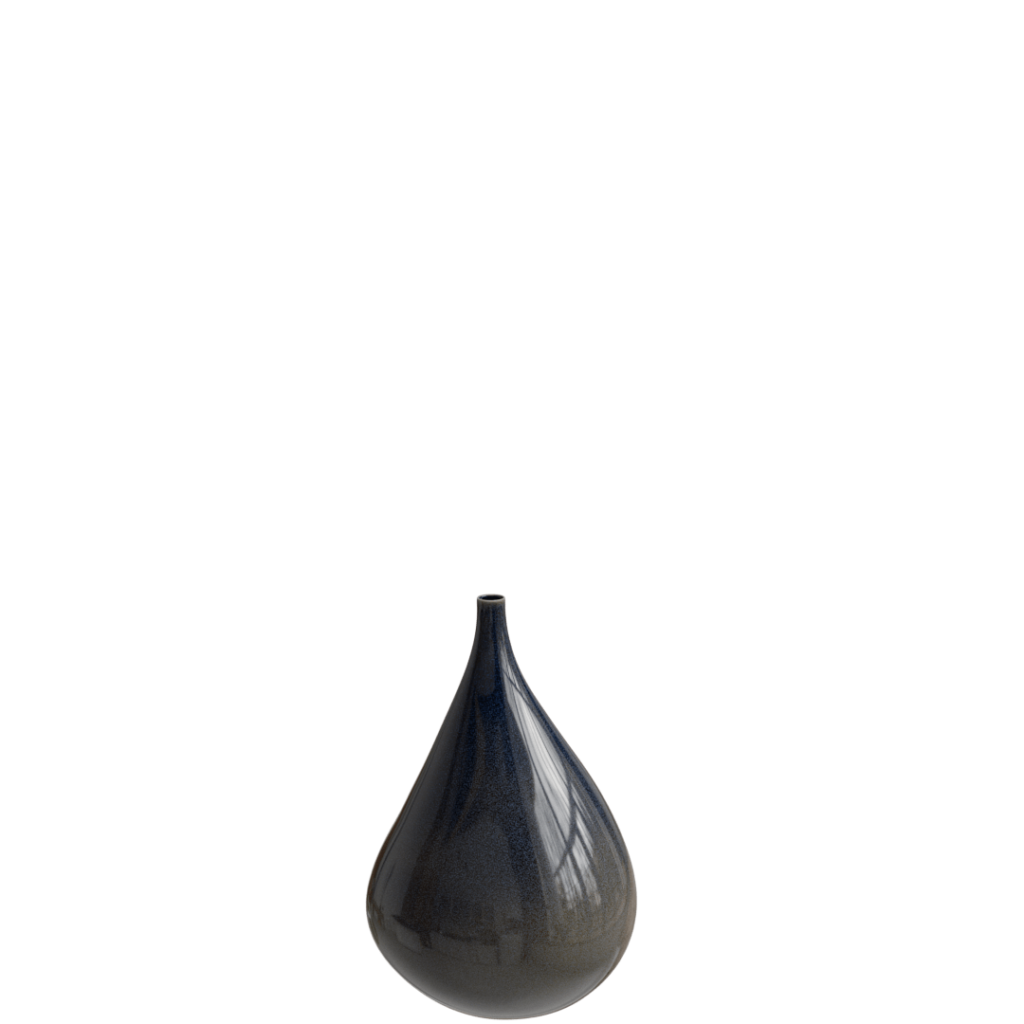
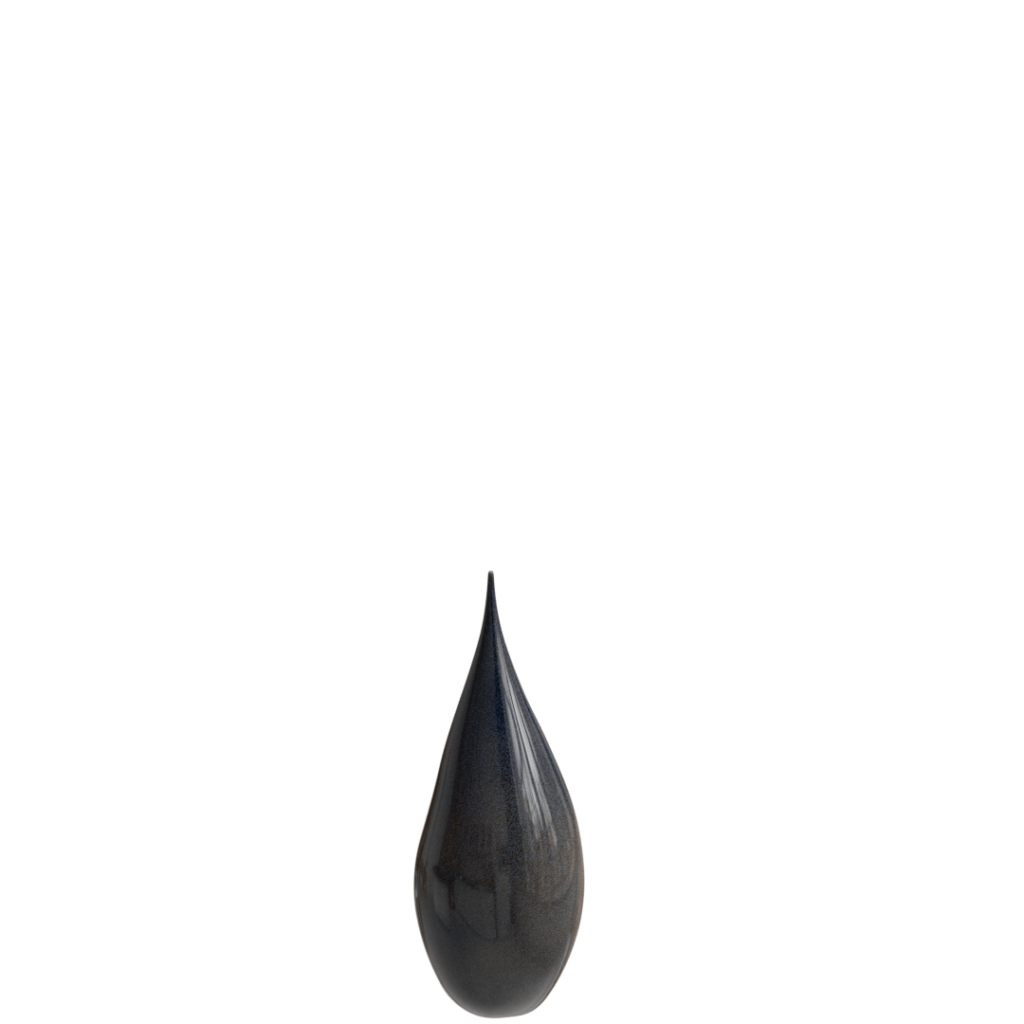
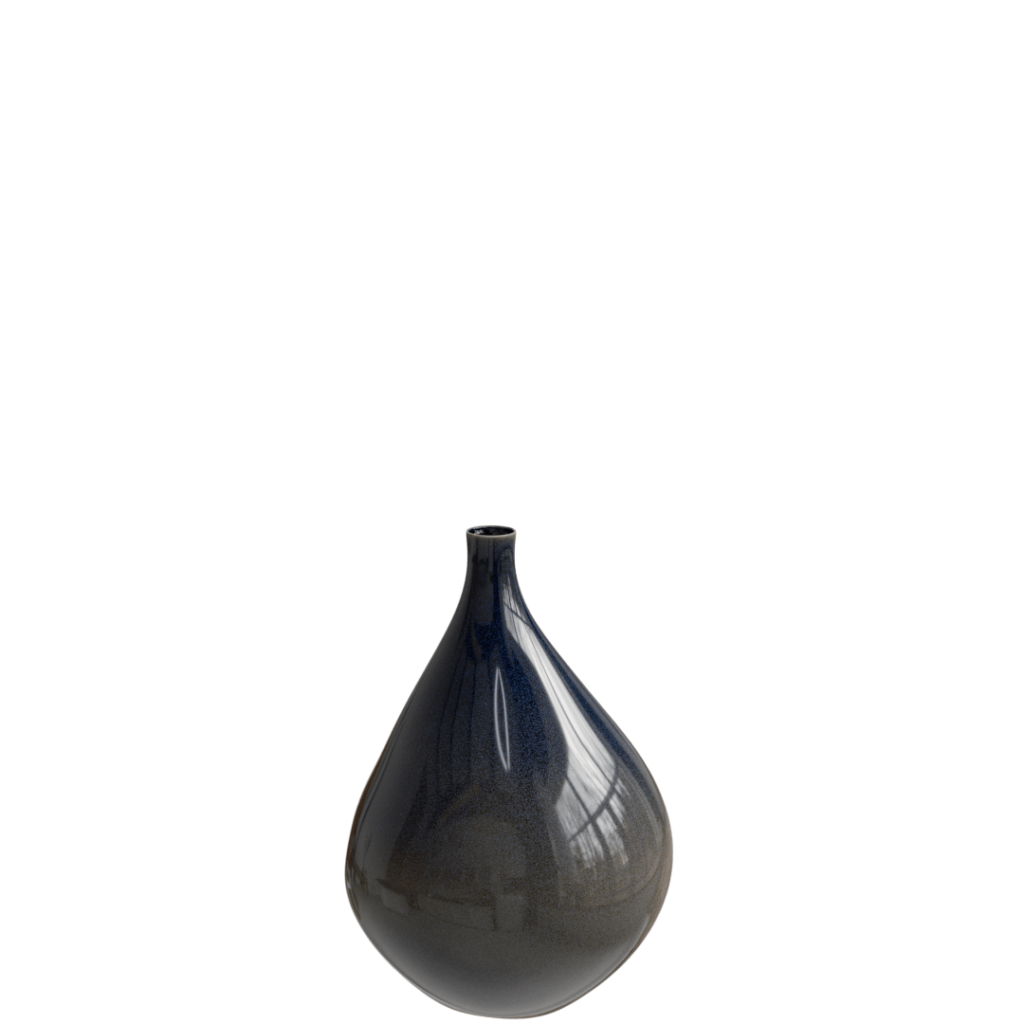
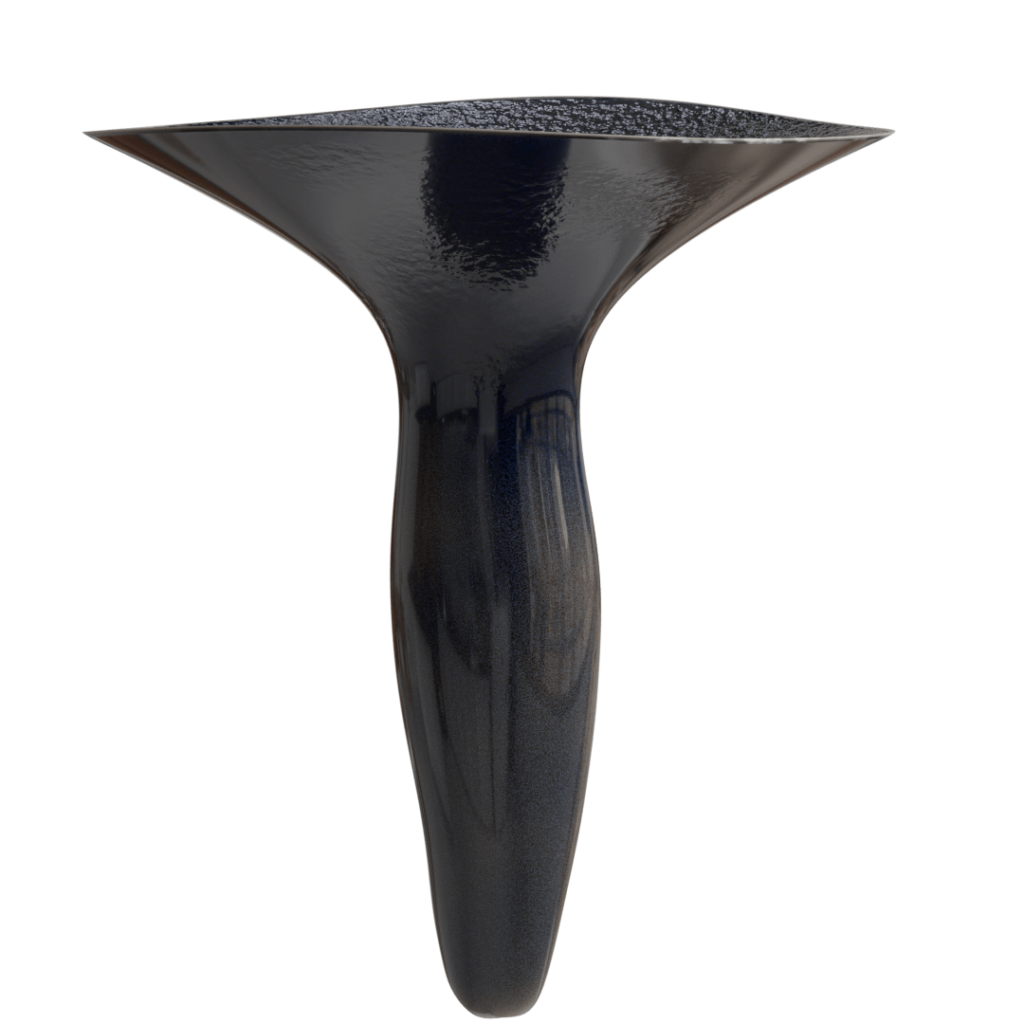
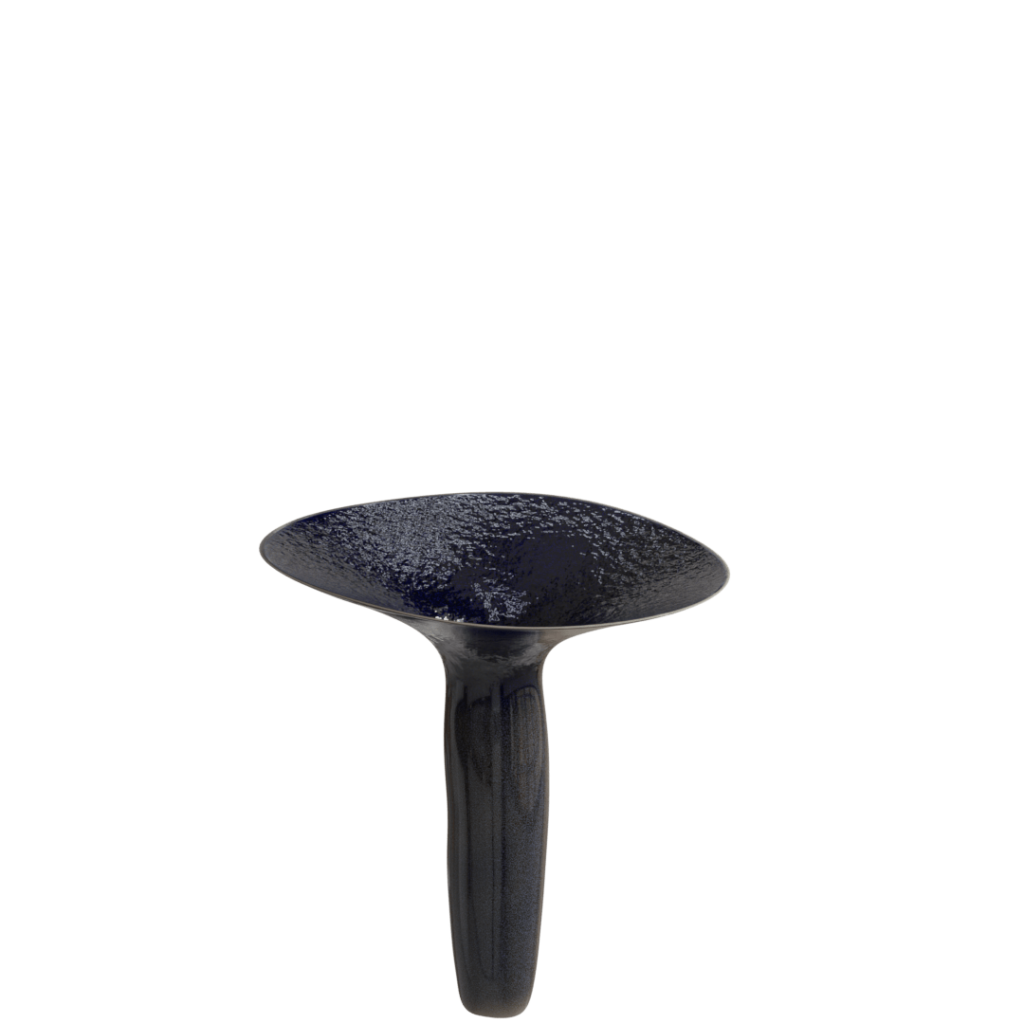
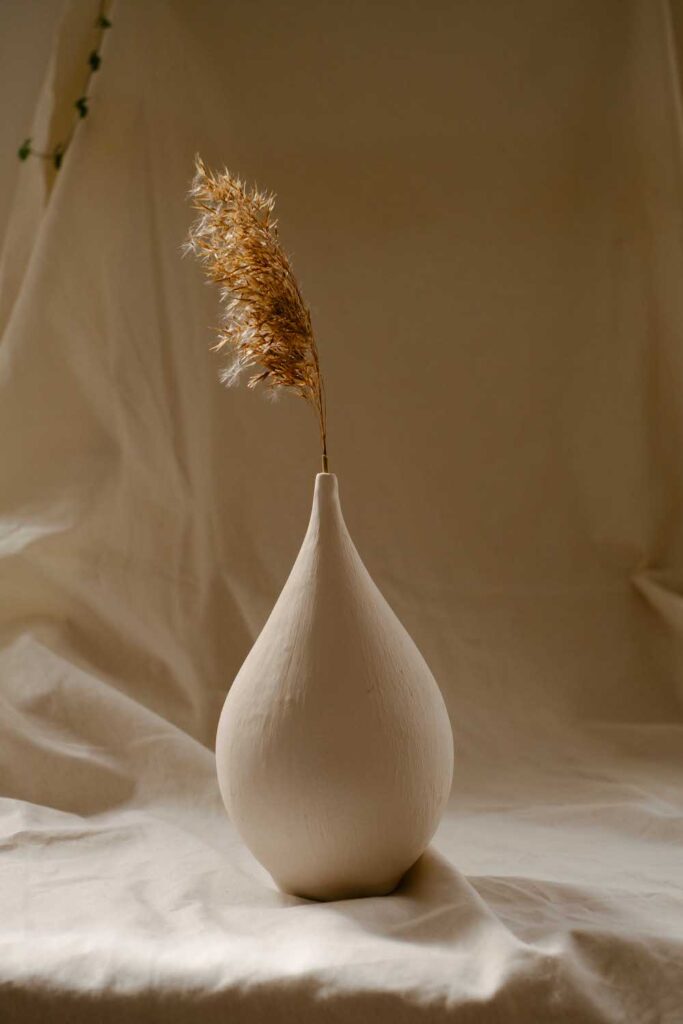
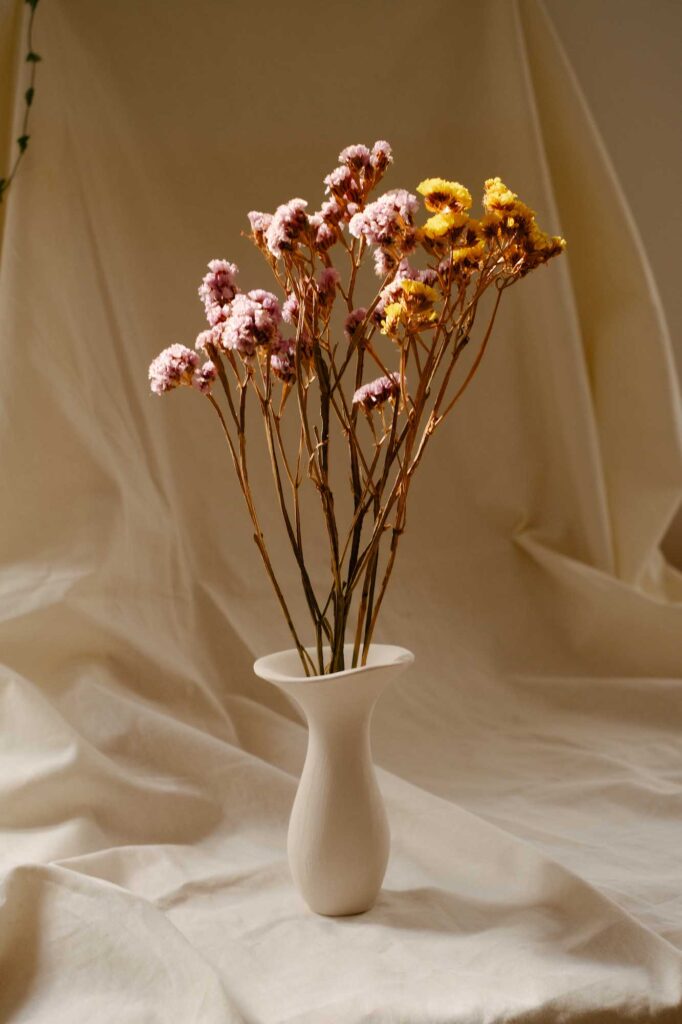
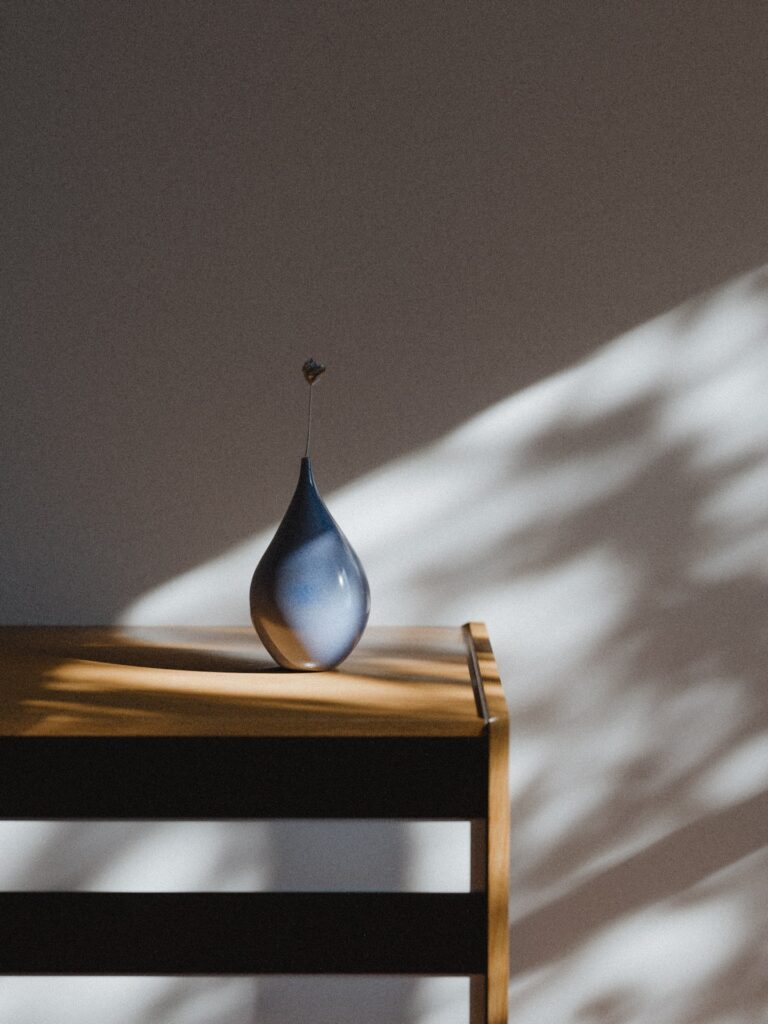
The aim was to create a functional object that symbolizes the influence of human activity on the earth’s ecosystems. A vase was found to be a suitable choice, as it is a tool to exhibit nature within our homes in a way that is a form of appropriation of nature itself. The idea for this object is to manipulate its geometry in such a way that values within the boundary lead to an open vase that can fit multiple flowers and plants and, vice versa, unsustainable values result in a narrow opening. The use of the consumption based control variable “Embodied Human Appropriation of Net Primary Production” (eHANPP) enabled to take into account land system change caused by a nation outside of its borders.