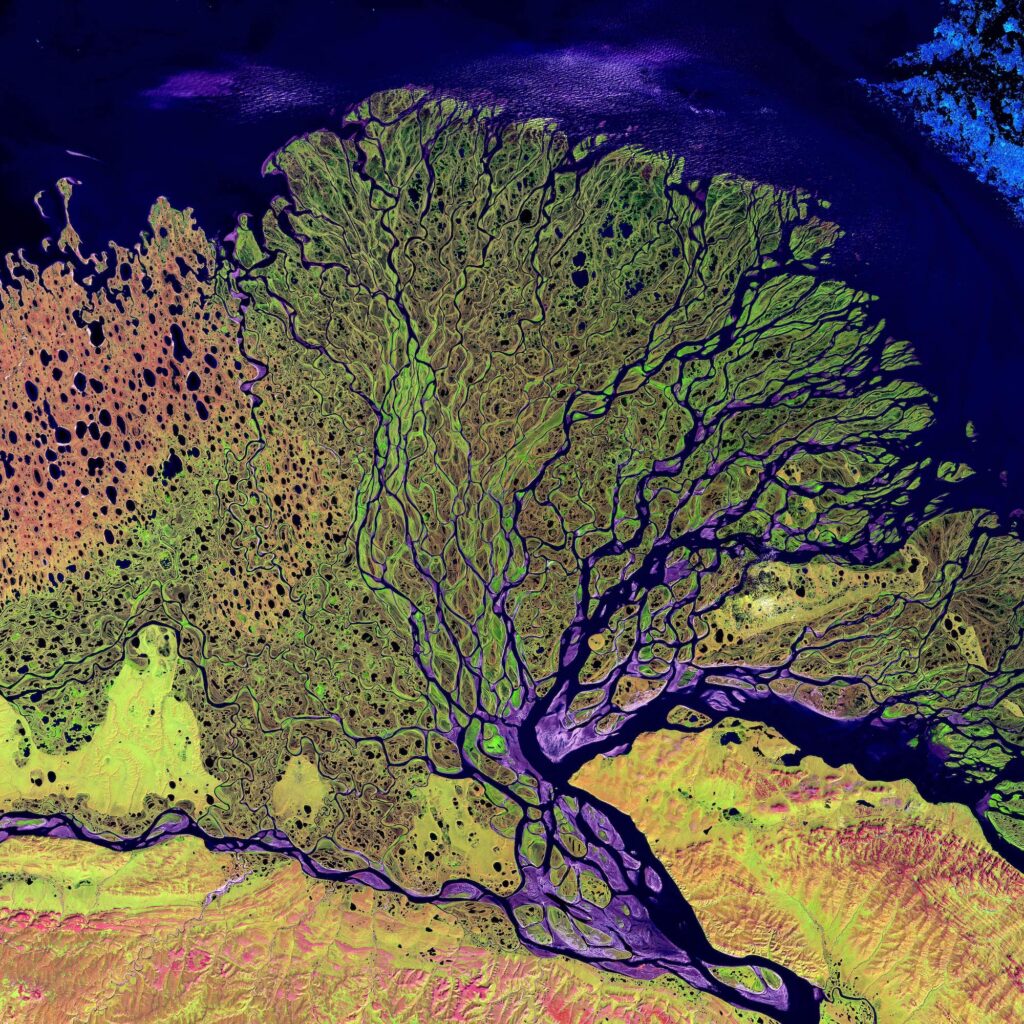
Modern agricultural and industrial practices have significantly altered the bio-chemical cycles of the planet, as nitrogen and phosphorus, essential elements for plant growth and fertilizer production, are now abundant. Much of these fertilizers end up in aquatic systems, promoting the growth of algae and causing a depletion of oxygen, leading to changes in the productivity of these ecosystems. When this process of eutrophication exceeds ecological limits, it results in the formation of coastal dead zones, which are areas of low oxygen and unsuitable for marine life.
CONCEPT
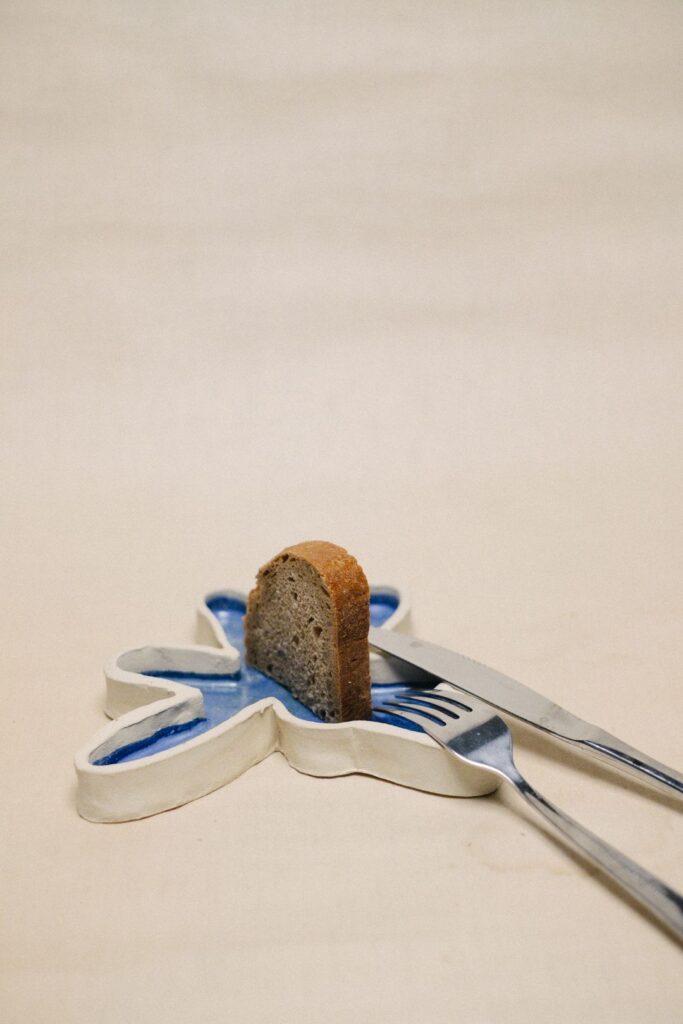
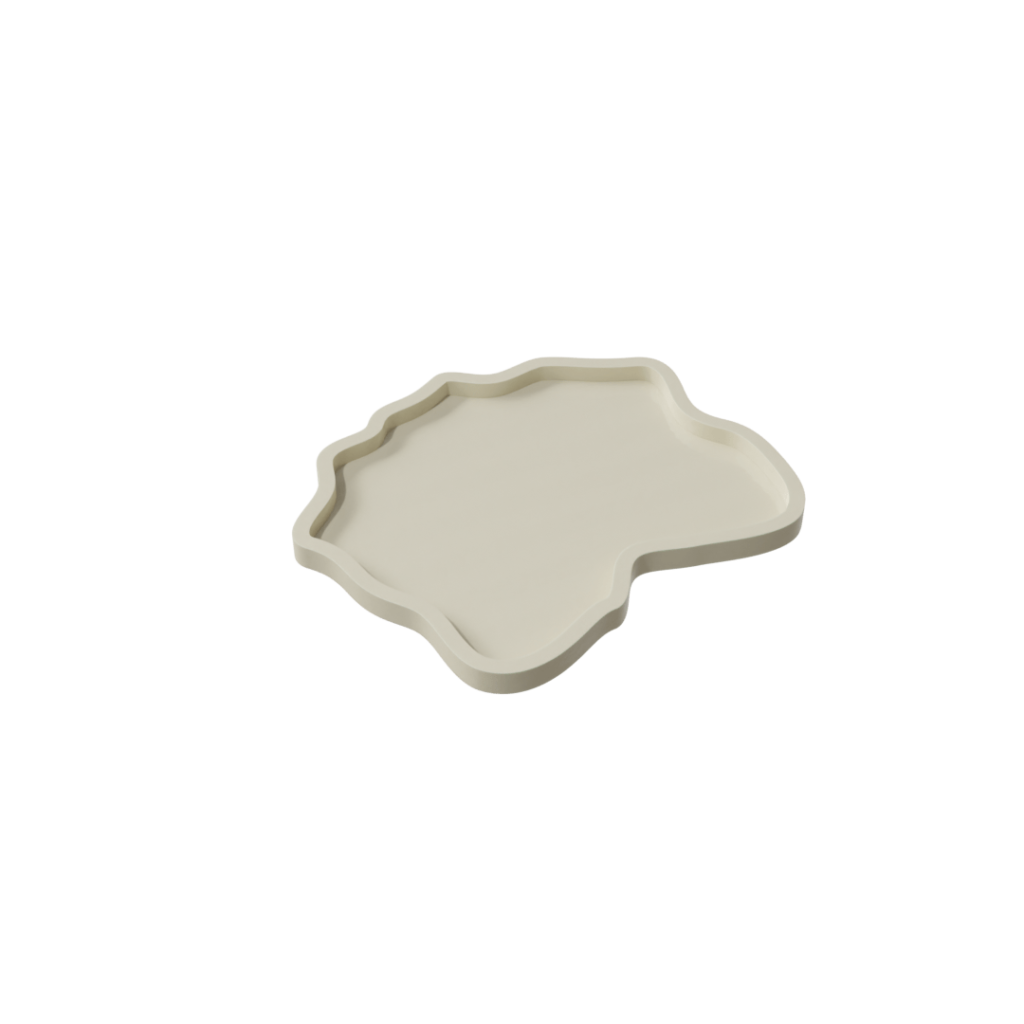
The object that displays the state of bio-chemical flows incorporates the main cause for the emissions as well as the systems that are primarily damaged. A plate was chosen, as modern food production strongly relies on the use of chemical fertilizers and the shape resembles a lake, one of the ecosystems mostly affected.
This boundary has two bio-physical control variables (nitrogen and phosphorus cycles), which both displace the body of the plate in different ways. Higher values result in a more unevenly shaped object, decreasing its functionality as a tool for serving food.
MALAYSIA1992
CONCEPT
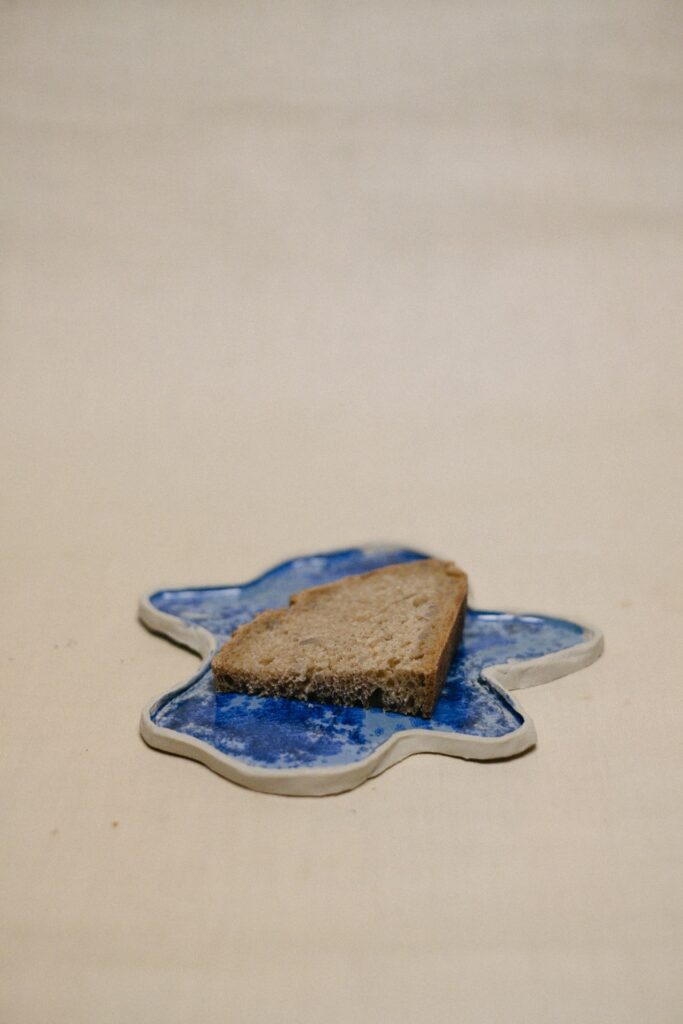
The object that displays the state of bio-chemical flows incorporates the main cause for the emissions as well as the systems that are primarily damaged. A plate was chosen, as modern food production strongly relies on the use of chemical fertilizers and the shape resembles a lake, one of the ecosystems mostly affected.
This boundary has two bio-physical control variables (nitrogen and phosphorus cycles), which both displace the body of the plate in different ways. Higher values result in a more unevenly shaped object, decreasing its functionality as a tool for serving food.